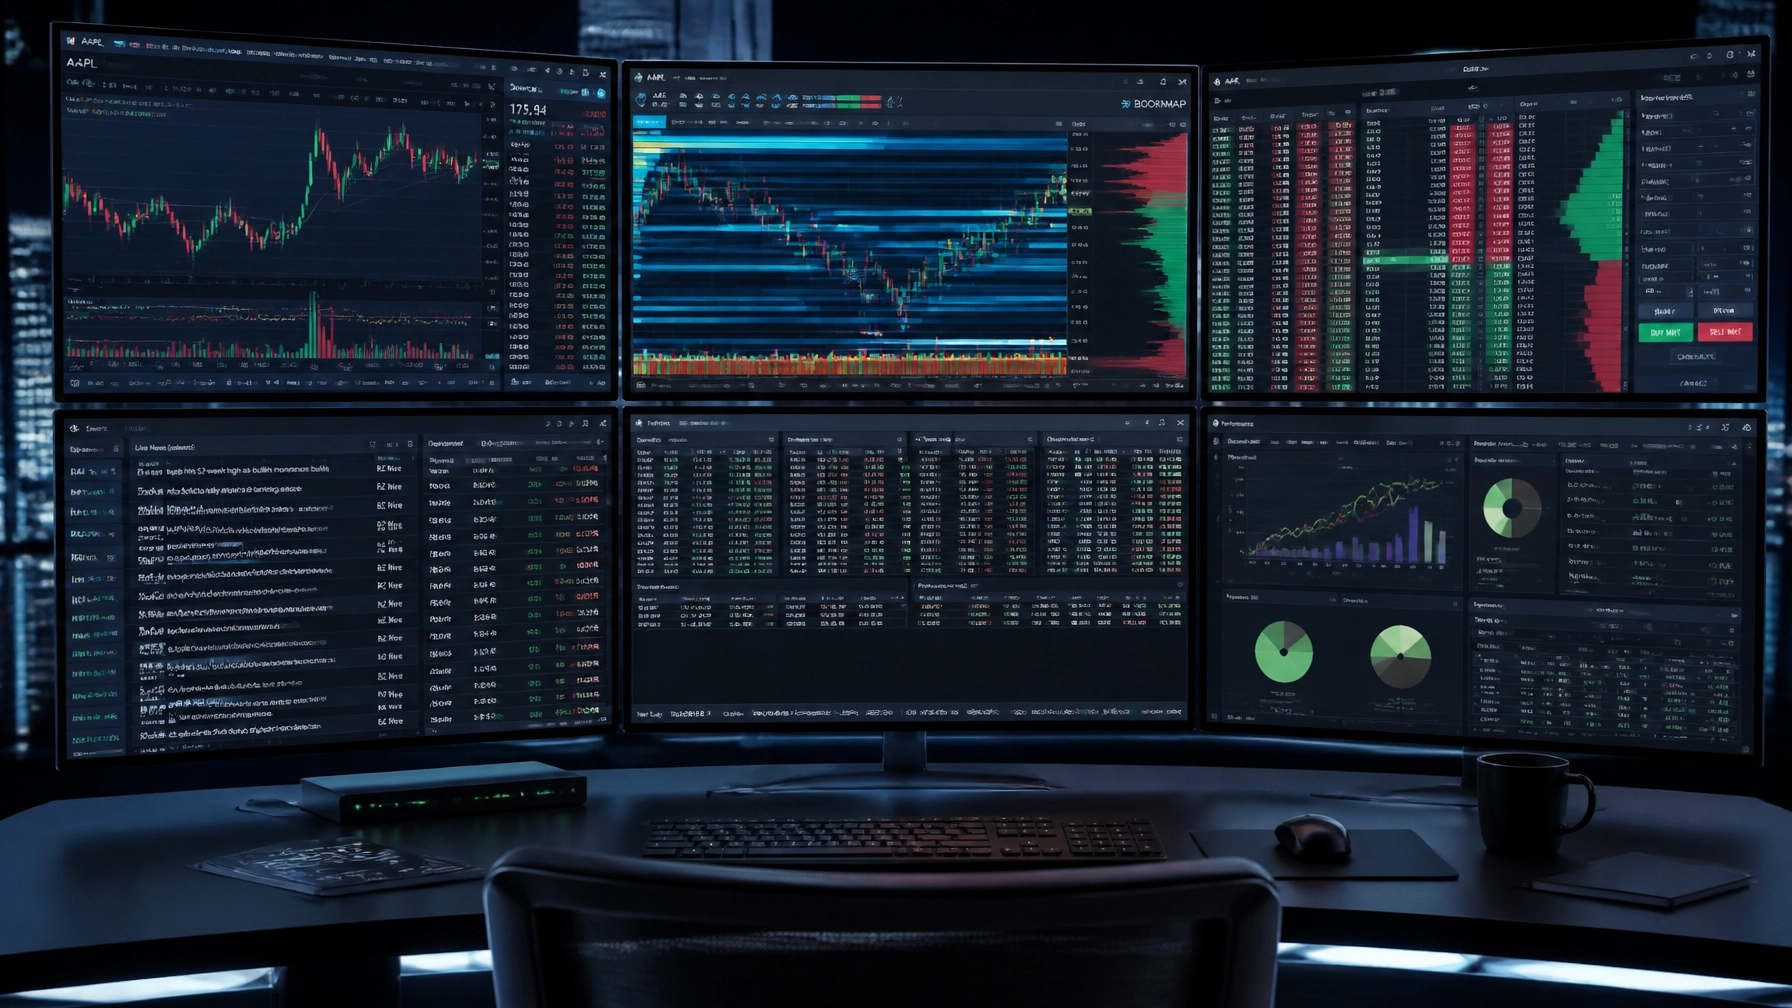
TradingView order flow tools move a trader from watching price alone to watching the auction itself: who is buying, who is selling, and how aggressively. This beginner’s guide covers the core tradingview volume profile tools, how to read footprint charts, and how these order flow indicators fit alongside Investing Bridge’s structural research rather than replacing it.
None of what follows replaces a wider research process. Order flow tools show what is happening on the tape right now; they do not, by themselves, tell a trader which zones are worth watching in the first place. That context still comes from the daily board.
Why TradingView Order Flow Goes Beyond Candlesticks
Traditional candlesticks compress a period of trading into an open, high, low, and close. Order flow tools decompress that same period, showing volume traded at the bid versus the ask, and revealing whether a level was defended by aggressive buying, aggressive selling, or absorbed quietly by resting liquidity. Market orders are described as aggressive because they actively hit the bid or lift the offer; limit orders are passive, providing the liquidity that aggressive orders trade against.
For a trader new to this style of reading price, the shift takes some adjustment. A candlestick chart answers what happened; tradingview order flow tools attempt to answer why it happened, which is a more useful question when trying to judge whether a level is likely to hold or break.
Configuring TradingView Volume Profile for Beginners
The tradingview volume profile tool is a horizontal histogram showing how much volume traded at each price level over a chosen period, rather than over each time interval. Three reference points matter most: the point of control, which is the single price with the highest traded volume; and the value area high and low, which together bound the range where most of that period’s volume occurred.
- Use Session Volume Profile for reading a single trading day in isolation.
- Use Visible Range for a broader swing-trading view across several sessions.
- Keep the value area setting near the standard 70 percent to identify the accepted “fair value” zone.
- Increase row size gradually for more granular high-volume and low-volume nodes.
High-volume nodes mark areas of heavy transaction where price tends to slow down or consolidate, since many participants already agree the level is fair. Low-volume nodes mark areas that traded through quickly, where price tends to move fast in either direction because few participants transacted there the first time.
Reading Footprint Charts: Aggression Versus Absorption
Footprint, or cluster, charts look inside each candle rather than only at its outer shape. They visualise market orders hitting the bid against orders lifting the offer, and the delta between them: the net difference between aggressive buying and aggressive selling within that bar. Reading footprint charts well means watching for three recurring patterns.
- Aggressive initiative: a strong positive or negative delta at a price extreme, showing real conviction behind the move.
- Passive absorption: price fails to move despite a large delta, meaning resting limit orders are quietly absorbing the aggression, which often precedes a reversal.
- Exhaustion: delta and volume both decline at a new high or low, suggesting the move is running out of institutional participation.
A related concept worth knowing is “unfinished business”: a candle high or low where both bid-side and ask-side transactions occurred, leaving the level unresolved. Price often returns to that level later in the session as the market seeks to finish clearing it.
Order Flow Indicators Worth Learning First
New users are better served starting with a small, well-understood indicator stack than trying to run every available order flow indicator at once. A practical starting stack covers volume profile for context, a footprint or cluster chart for delta, and a volume-weighted average price line as a simple intraday fair-value reference.
Chart cleanliness matters more than most beginners expect. Overlapping indicators competing for the same visual space make footprint reading harder, not easier. Keeping order flow visuals primary and removing unrelated overlays is one of the simplest ways to make tradingview order flow data easier to read under time pressure.
Aligning TradingView Order Flow With the Ten-Factor Board
Order flow indicators confirm a level; they rarely identify one from scratch. Investing Bridge’s daily board, published at 09:30 EET, maps supply and demand zones and option expiry context across ten confluence factors first. TradingView’s volume profile and footprint tools are then used to check whether real-time volume actually supports that mapped level once price arrives.
- Review the daily board to identify structural levels for the session.
- Check TradingView’s Volume Profile for a high-volume node near that level.
- Watch the footprint chart for delta imbalance or absorption as price enters the zone.
- Confirm the reaction before treating the zone as validated, rather than acting on the zone alone.
This is also where OANDA order and position book data adds a second, independent confirmation layer: a level that lines up across the daily board, TradingView’s volume profile, and the OANDA book carries more weight than any single source alone.
A Beginner’s TradingView Order Flow Workflow
For beginners just setting up TradingView order flow tools, a simple sequence works better than trying to master every feature at once. Start each session by reviewing the board, then open Volume Profile Visible Range to mark recent high-volume nodes as reference points before the session begins.
Once price approaches a mapped level, switch attention to the footprint or delta chart rather than the plain candlestick view. Watching for absorption or aggressive initiative at that specific moment is far more informative than watching delta scroll by throughout the session with no reference point in mind.
Professional traders do not lean on lagging indicators; they read the auction process directly. By learning tradingview order flow, footprint charts, and volume profile together, a beginner moves from guessing where price might go to observing where capital is actually being committed. Explore the daily board and full ten-factor research at investingbridge.eu/preview, with a 7-day free trial and a subscription of EUR 19 per month thereafter.
Common Mistakes When Learning TradingView Order Flow
The most common beginner mistake is treating every high-volume node as a trade signal on its own. A node only becomes useful once it lines up with a structural zone already identified elsewhere; in open space, a high-volume node is simply a record of past agreement, not a forecast of future direction.
A second mistake is reading delta on every single candle rather than at meaningful decision points. Delta is noisy minute to minute, and chasing every flicker in tradingview order flow data leads to overtrading. Watching delta specifically as price tests a pre-identified level filters out most of that noise.
A third mistake is ignoring timeframe mismatch. Volume Profile built on Visible Range across weeks tells a different story than Session Volume Profile for the current day alone. Beginners often compare nodes across mismatched timeframes without realising the two views are answering different questions.
TradingView Volume Profile Versus Traditional Support and Resistance
Traditional support and resistance lines are typically drawn from swing highs and lows, which capture where price reversed but say nothing about how much volume actually traded there. Tradingview volume profile instead measures participation directly, so a level can look important on a candlestick chart while having relatively thin volume behind it, or vice versa.
This distinction matters most when a swing high or low does not coincide with a high-volume node. In that case, the structural level from price action and the volume-based level from the profile are giving different information, and a beginner benefits from treating the mismatch as a reason for caution rather than picking whichever view supports the trade they already want to take.
Reading Footprint Charts Around News Releases
High-impact news releases distort footprint data temporarily. Delta readings during the first few seconds after a release often reflect algorithmic reaction rather than considered institutional positioning, and spreads widen enough that footprint prints can look more aggressive than the underlying liquidity actually supports.
For beginners specifically, waiting several minutes after a major release before trusting footprint signals again is a simple, effective habit. Reading footprint charts in the middle of that initial volatility spike tends to produce false reads that look convincing in the moment and fall apart once liquidity normalises.
Building Confidence With TradingView Order Flow Over Time
Confidence with these tools comes from repetition against a consistent process, not from memorising indicator settings. Reviewing the same handful of order flow indicators around the same daily board levels, session after session, builds the pattern recognition that no single tutorial can substitute for.
Keeping a simple record of which volume profile nodes and footprint patterns preceded genuine reactions, versus which ones failed, turns TradingView order flow study into a compounding skill rather than a one-time setup exercise. That habit of review is the same discipline that runs through the rest of Investing Bridge’s daily research process.
Setting Up TradingView for Order Flow: A Practical Checklist
Before relying on any reading, it helps to confirm the chart setup itself is sound. Time zone alignment matters: TradingView should be set to match the session being analysed, whether that is EET for the European morning board or the New York session for later confirmation, so that footprint and volume profile readings line up with the correct trading hours.
Data quality is the second checklist item. Where available, using top-of-book or Level 2 style data feeds produces more accurate footprint prints than a lower-resolution feed, particularly around fast-moving levels where every print matters for judging whether absorption or aggression is really happening.
The final checklist item is simply restraint: resisting the temptation to add every available order flow indicator to the same chart. A clean layout with volume profile, one footprint or delta view, and a single reference line such as VWAP is easier to read under pressure than a chart crowded with five overlapping tools.
None of this requires a paid data feed to begin. Free-tier TradingView access is enough to practice reading volume profile and basic footprint concepts; upgrading data quality becomes worthwhile later, once the underlying reading skill is already solid rather than being used to compensate for a rushed process.
Beginners sometimes ask whether tradingview order flow tools work the same way on crypto or index charts as they do on forex pairs. The mechanics are identical since volume profile and footprint data simply reflect traded volume at price, but liquidity depth varies a great deal by instrument, so the same node size that looks significant on a major FX pair may be comparatively thin on a smaller altcoin or single-stock future.
That liquidity difference is worth checking before trusting a node the same way across instruments. A quick glance at typical daily volume for the chosen symbol gives a rough sense of whether a given high-volume node reflects genuine broad participation or a comparatively thin market where a handful of large orders can distort the profile.
How TradingView Order Flow Compares to Bookmap and NinjaTrader
TradingView is not the only platform offering this style of analysis. Traders coming from Bookmap’s heatmap and footprint view or from NinjaTrader’s footprint charting will recognise the same underlying concepts here: volume at price, delta, and absorption, just presented through a different interface built around exchange-traded volume such as the futures data published by CME Group.
The choice between platforms usually comes down to workflow rather than data quality. TradingView’s browser-based access makes it a practical starting point for beginners, while Bookmap and NinjaTrader are often preferred by traders who want a dedicated, always-on order flow workstation. The reading skills built with tradingview order flow tools transfer directly to either.
Frequently Asked Questions
What is the easiest tradingview volume profile setting for beginners?
Session Volume Profile with the value area kept near the standard 70 percent is the simplest starting configuration, since it highlights the point of control and value area boundaries for a single trading day.
How do I start reading footprint charts as a beginner?
Start by watching for aggressive initiative, passive absorption, and exhaustion at price extremes rather than trying to read every print; those three patterns cover most of what footprint charts are used for in practice.
Which order flow indicators should a beginner learn first?
Volume profile, a footprint or cluster chart, and a volume-weighted average price line form a practical starting stack; adding more order flow indicators before these three are understood usually adds noise rather than clarity.
Is tradingview order flow enough on its own to trade?
No. Tradingview order flow tools confirm whether real-time volume supports a level, but the level itself should come from structural research such as supply and demand zones, option expiries, and COT positioning first.
Investing Bridge provides educational market research, not investment advice. Trading involves substantial risk of loss.